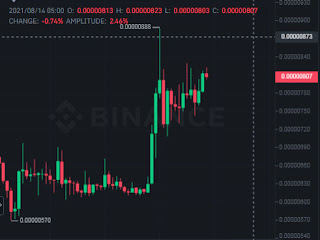
Shiba Inu price hints at indecision as a technical chart pattern has formed, suggesting that SHIB price may move sideways in the near term before targeting bigger aspirations. A break above the descending trend line may indicate that the canine-themed crypto is ready for an escape to the upside.
Shiba Inu price has formed a symmetrical triangle pattern on the 4-hour chart, signaling a price pullback prior to its next ascent. By connecting the lower highs and the higher lows, two converging trend lines form the chart pattern.
Moving forward, SHIB price may consolidate within the governing technical pattern before a breakout occurs.
Currently, the only obstacle for Shiba Inu's price toward the upside is the topside trend line of the symmetrical triangle pattern and the 78.6% Fibonacci extension level at $0.00000819.
Should SHIB price see accelerated interest and a spike in buying pressure, Shiba Inu could slice above the resistance level, which could put the target given by the chart pattern, a rally of 16% to $0.00000954.
Since the prevailing chart pattern suggests that Shiba Inu would experience a price pullback before its next big move, Shiba Inu finds its first line of defense at the 20 four-hour Simple Moving Average at $0.00000787.
Further increase in selling pressure would push Shiba Inu's price down to test the lower boundary of the symmetrical triangle pattern at a price of $0.00000757, joined by the 50 four-hour SMA.
Although this level should act as a meaningful support level for SHIB, a reversal of fortune could send the token lower to the 38.2% Fibonacci extension level, coinciding with the 100 four-hour SMA at a price of $0.00000691.
Only an extreme escalation of downward pressure could drive Shiba Inu's price lower to the 27.2% Fibonacci extension at a price of $0.00000656.

0 Comments