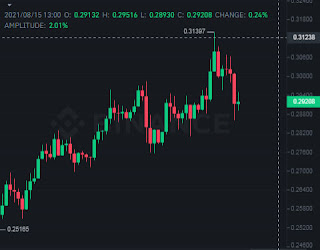
Dogecoin could be primed for a 19% collapse after a bearish chart pattern emerged, along with a top signal by a technical indicator. DOGE price is also met with stiff resistance, not allowing higher targets to be approached.
Dogecoin price has printed a rising wedge on the daily chart, suggesting a bearish forecast for DOGE.
Although the canine-themed token has gained nearly 80% since its price swing low on July 20, hinting that the Dogecoin price may be awaiting a trend reversal.
The governing technical pattern indicates that Dogecoin would drop by 19%, reaching a downside target at a price of $0.221, corresponding with the 50-day Simple Moving Average (SMA).
The Momentum Reversal Indicator flashed a top signal, further adding credence to the bearish thesis. The Relative Strength Index also suggests that DOGE price may be slightly overbought.
However, the DOGE price may see ample support before the bearish aim materializes. The first line of defense for Dogecoin is at the lower boundary of the rising wedge, coinciding with the 27.2% Fibonacci retracement at $0.259.
The next support level is at the 38.2% Fibonacci retracement level at a price of $0.244, then the 50% Fibonacci retracement level, joining the 20-day SMA at $0.228.
Should the Dogecoin price continues to fail to galvanize investors' enthusiasm, the DOGE price may test the 61.8% Fibonacci retracement level at a price of $0.212 before sliding further down to the 200-day SMA.
On the other hand, if the Dogecoin price is able to slice and close above the 100-day SMA at a price of $0.296 and the upper boundary of the rising wedge pattern at a price of $0.302, the IntoTheBlock’s In/Out of the Money Around Price metric reveals large clusters of resistances ahead.
The next obstacle for Dogecoin's price is at $0.308, with 51,700 addresses holding 2.88 billion DOGE.
Overall, the IOMAP suggests that the Dogecoin price is would see major challenges ahead if it attempts to record a higher high for August.

0 Comments