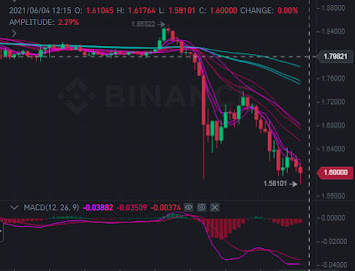
MATIC's strength has been a positive highlight of the May price correction, despite the plunge of 75%. The extraordinary rebound of 230% from the correction low on May 23 combined with the negative correlation with Bitcoin and clarified price structure has positioned Polygon Matic in an advantageous position to tackle new highs in the coming weeks.
Until the May 19 collective collapse in the cryptocurrency market, Polygon MATIC price had engineered a tremendous rally of 500% following the decisive breakout from a multi-week consolidation on April 26. The breakout was accompanied by a substantial price surge in volume and generated the most overbought readings on the daily RSI since February.
Like other digital assets, the May 19-23 stretch shattered Polygon MATIC price strength, taking it down 75% before identifying support at the tactically important 50-day simple moving average at $0.791 but remained above the 2021 rising trend line level at $0.645.
As leading cryptocurrencies should do, MATIC's price rebounded 230% from the May 23 low, quickly establishing the technical foundation for the currently developing cup-with-handle pattern base. The base evolution has been consistent with success. The right side of the cup pattern is flashing above-average volume, with the handle primarily forming in the upper half of the base level on an increasingly lighter volume. The lighter Polygon Matic volume indicates that weak holders have been evacuated from the token, raising the probability of a sustainable breakout.
The base has a trigger price of $2.48, the high of the handle pattern, so investors need to let the handle complete its formation. Due to the cup’s compressed side, the handle has been extended a bit longer to release the Matic price compression, but the price should be close to a breakout attempt.
The measured move target of the Polygon Matic cup-with-handle base is $8.20, producing a 230% gain from the handle high for investors.
On the path to the measured move target is the substantive resistance level at the intersection of the 161.8% Fibonacci extension of the May price correction at $4.21 with the topside trendline from the March high through the May high at a price of $4.30, returning a gain of 65% from the handle high.
Additional Polygon resistance levels preceding the measured move target need to be calculated once the resistance level listed above has been surmounted.
Keen Polygon Matic investors must be informed of the critical support levels, particularly as the base continues to shape. Key to the bullish narrative is the low of the handle at a price of $1.51. A close below the price would expose Plygon MATIC price to a decline to the 50-day SMA, currently at a price of $1.12. It would be a loss that cripples projections for new highs in the next few months.
Placing relative strength at or near the top of any investment selection process is a valuable step in securing outsized returns following sizeable market price corrections. One of the ways to gauge it in the cryptocurrency market is to examine the correlation with Bitcoin BTC. A high correlation leaves it to BTC’s sphere of influence, good or bad, and a negative correlation can signify relative strength.
With the outlook for Bitcoin BTC somewhat cloudy due to regulatory concerns and significant technical resistance on the charts, it is compelling to see that Polygon Matic has a negative correlation with BTC. Currently, it has a reading of -.78, the lowest since July 2019.
It highlights the strength of Polygon Matic over the last month and suggests that the short-term instabilities in Bitcoin BTC will not jeopardize the ongoing base construction.

0 Comments